

In this article we will learn how to add pivot table in excel sheet and how to use it to create a summary of data.
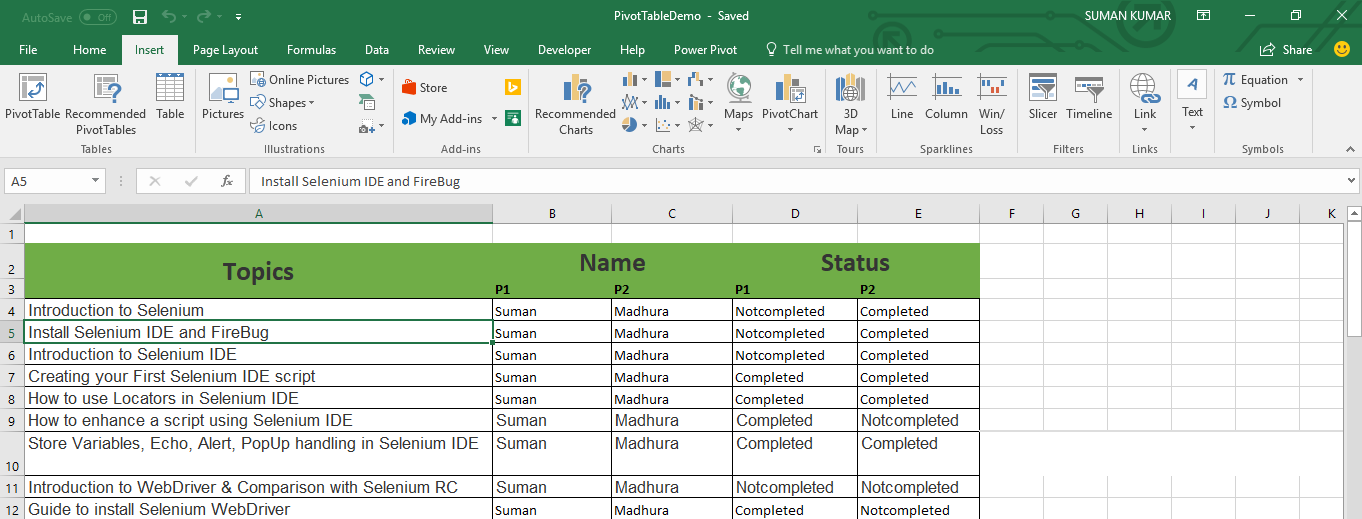
Step1: We will pick a excel file with some sample data, click here to download
Step2: Select any active cell from data set and go to insert tab :
Step3: Click on Pivot table option as shown below 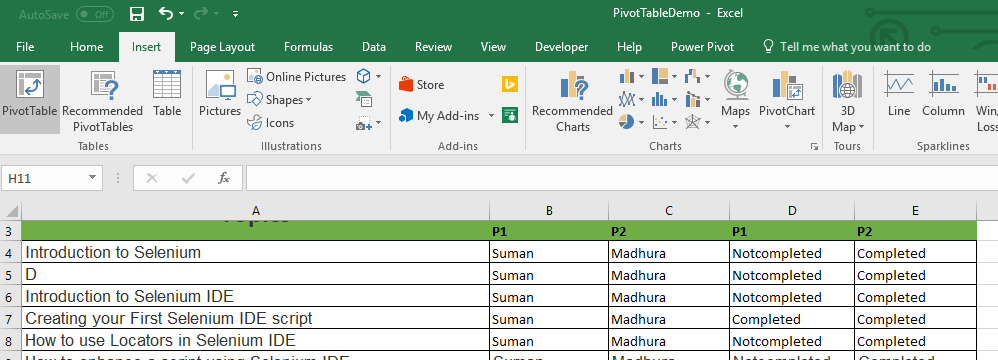
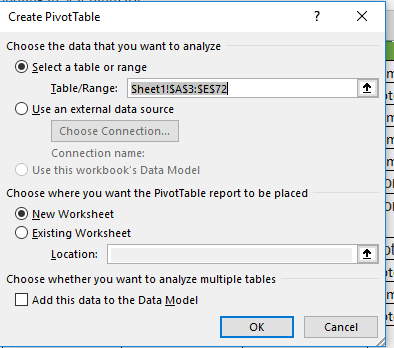
Step4: Select range for pivot table as shown below-
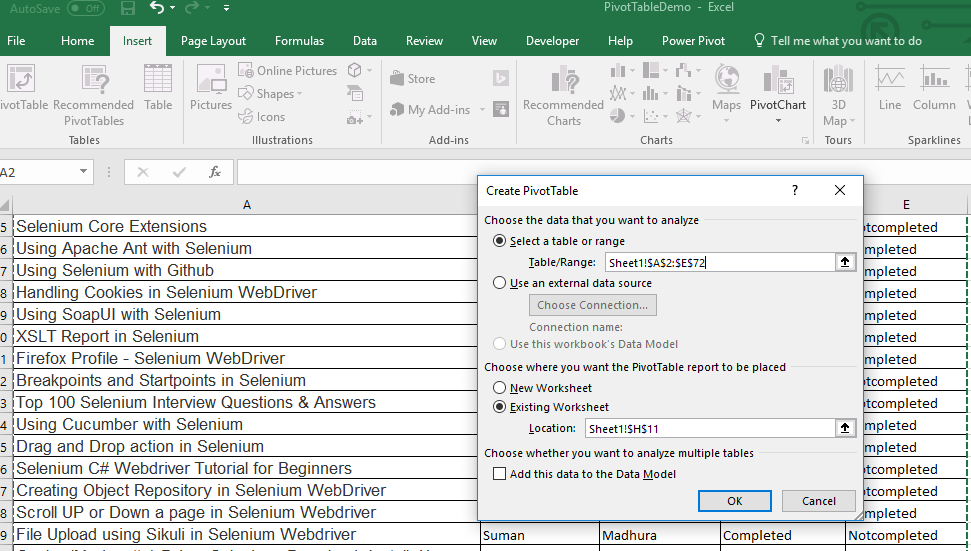
Step5 Select new worksheet for PivotTable report
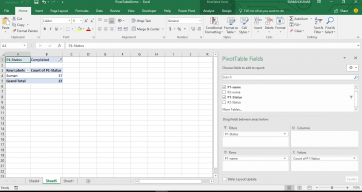
Step6: Now select he field as per requirement, for example here I want to see the number of topics completed by Suman.
P1- Name I have added in in Rows section and P1- status into summation section.

Basic summary table is ready now, we will cover more in next article about Pivot table.